Portrait of Beatriz Pinheiro UX Researcher · Customer insights · Market research

Every question deserves the right method.

I'm a UX researcher with a design background. I help product teams turn open questions into clear decisions, choosing the method that fits, from a quick heuristic review to mixed-methods studies across different markets.

Why are people getting stuck?

Feedback analysis and funnel data

Will users find this feature?

Unmoderated click test

Is this MVP ready to launch?

Heuristic review and competitor research

What do customers in ten markets need?

Local-language interviews and a survey

I work with Product ownersProduct designersData analyticsEngineeringSalesMarketingFounders
Approach

How I choose and combine methods

Research starts in many places, and there is no single recipe. Sometimes one method is enough: a heuristic review, a tree test or a look at live data. When a decision carries more risk or the picture is unclear, I combine methods and check them against each other.

1 · THE QUESTION Comes from A team request A signal in the data A design problem statement A new flow to de-risk Earlier research findings 2 · CHOOSE THE METHOD One method, or several Qualitative Interviews, usability tests Quantitative Analytics, surveys, live data Evaluative Heuristics, tree and click tests Desk research Secondary, market, competitors 3 · CROSS-CHECK When needed Compare sources 4 · DECISION Act and track Prioritised with the team findings often raise the next question
  1. 1 · The questionComes from

    A team request, a signal in the data, a design problem statement, a new flow to de-risk, or earlier research findings.

  2. 2 · Choose the methodOne method, or several
    • QualitativeInterviews, usability tests
    • QuantitativeAnalytics, surveys, live data
    • EvaluativeHeuristics, tree and click tests
    • Desk researchSecondary, market, competitors
  3. 3 · Cross-checkWhen needed

    Compare sources.

  4. 4 · DecisionAct and track

    Prioritised with the team.

↺ Findings often raise the next question.

Projects

The research process, project by project

Each project shows the steps I took, why I chose each method, and where the sources came together. Details are anonymised to respect confidentiality.

01 Automotive
Feedback analysisSecondary researchFunnel data

Finding the real barriers in vehicle onboarding

Adding a vehicle was the fastest-growing theme in customer feedback. The team assumed people couldn't find where to start.

230+customer comments coded
4quarters of feedback reviewed
5hypotheses tested
100,000ssessions analysed
Research process
  1. Feedback analysisQualitative

    Coded 230+ comments from four quarters of in-product feedback into themes.

    WhyStart from what customers already say before spending on new fieldwork.

  2. Secondary researchQualitative

    Re-watched usability recordings and reviewed an earlier study in two days.

    WhyComments say what hurts; recordings show the behaviour behind it.

  3. HypothesesSynthesis

    Turned the patterns into five testable hypotheses.

    WhyQualitative data shows what happens, not how often. Hypotheses make it measurable.

  4. Funnel analysisQuantitative

    Sized each hypothesis with data analysts across hundreds of thousands of sessions.

    WhyA number on every problem lets the team rank them.

  5. TriangulationQual + quant

    Compared feedback, recordings and funnel data step by step. Some hypotheses were confirmed and others disproved: the entry point was not the problem, and adding a second vehicle was far easier than the first.

  6. Ranked recommendationsSynthesis

    Ranked fixes by problem size and effort and played them back to product and design.

With
Product owners, product designers, data analytics
Decision
The team moved its focus from the entry point to the vehicle number and pairing steps in the new mobile-first flow.

02 Automotive
Click testsNavigation testQuestionnaire

Testing a dashboard for drivers and fleet managers

A redesigned vehicle dashboard had to work for private drivers and business fleet managers before the team committed to building it.

~165car owners in the study
3test types: navigation, click, questionnaire
2audiences: drivers and fleet managers
Research process
  1. Goal settingSetup

    Agreed three goals with product: gaps between pages, private vs business clarity, and grid vs list layout.

    WhyClear goals decided the method mix and kept the study focused.

  2. RecruitmentSetup

    Screened ~165 car owners, covering both private and business use.

    WhyTesting both audiences in one study made them directly comparable.

  3. Navigation and click testsQuantitative

    Measured first clicks and task success on the prototype.

    WhySuccess rates at scale show which structure works.

  4. QuestionnaireQualitative

    Captured expectations and the reasons behind people's choices.

    WhyClicks alone can't explain intent.

  5. TriangulationQual + quant

    Matched click patterns with what people said. This revealed a clear reading order (status, then risk, then action) and showed that prominent elements got clicks even when people were unsure what they did.

With
Product owners, product designers
Decision
The team set the dashboard's information order and refined the layout and account switching before build.
03 Automotive · AI
Synthetic usersPrototype testingMethod evaluation

Early evidence with synthetic users

The team had a basic prototype and wanted early evidence before investing in recruitment and full testing. I explored whether synthetic users could fill that gap, and where they fall short.

Research process
  1. ScopingSetup

    Defined what synthetic users could answer (early usability and comprehension) and what they couldn't (real motivation and emotion).

    WhyA clear scope stops the team from trusting the output beyond what it can show.

  2. Grounded profilesSecondary

    Built synthetic user profiles from existing research and known customer segments.

    WhyProfiles based on real data give more realistic responses than generic personas.

  3. Prototype sessionsSynthetic

    Ran the synthetic users through the prototype's key tasks and collected their reactions and questions.

  4. TriangulationSynthetic + real data

    Compared the synthetic responses with findings from earlier studies with real users, to see where they matched and where they drifted.

  5. Strengths and limitsSynthesis

    It worked well for fast, low-cost feedback and for flagging obvious usability issues. Its limits: answers that were too agreeable, no real context or emotion, and missed edge cases.

With
Product designers, product owners, research team
Decision
The team used the results as early evidence to improve the prototype before testing with real users, along with guidance on when synthetic users are and aren't appropriate.
04 Automotive
HEART frameworkWorkshopsUX metrics

Making experience metrics actionable

Product teams tracked many numbers, but had no shared view of which ones would lead to action.

2product teams
5HEART dimensions
1metric per signal
Research process
  1. PreparationSetup

    Reviewed each team's goals and existing tracking before the workshops.

    WhyStart from what is already measurable.

  2. HEART workshopsCo-creation

    Facilitated sessions for two product teams, moving from goals to signals to one metric per signal across Happiness, Engagement, Adoption, Retention and Task success.

  3. "So what" reviewSynthesis

    Tested every metric with one question: if this number changed a lot, would we do something?

    WhyNumbers nobody would act on only add noise.

  4. Event mappingQuantitative

    Mapped each metric to exact tracking events with data analysts.

    WhyA metric without a precise definition can't be built or trusted.

  5. PrioritisationCo-creation

    Placed metrics on an impact/effort matrix with the team, then agreed an owner, timeframe and action for each.

With
Product owners, product designers, data analytics, research team
Decision
Teams now plan their tracking and dashboard work from one agreed list, and each metric comes with an action they have already agreed to take.
05 Fashion e-commerce
InterviewsSurveyBehavioural data

Localisation research across 10 markets

The business lacked a clear view of how customers in non-English-speaking markets experienced its copy, size and fit information and product descriptions.

10markets
Locallanguage for every interview
4sources combined
Markets in this study
BRBrazil
MXMexico
FRFrance
DEGermany
UKUnited Kingdom
ITItaly
SASaudi Arabia
AEUAE
USUnited States
AUAustralia
Research process
  1. Existing researchSecondary

    Reviewed past studies to see what was already known in each market.

    WhyFocus new fieldwork on the real gaps.

  2. InterviewsQualitative

    Ran one-to-one interviews in each customer's own language across Brazil, Mexico, France, Germany, the UK, Italy, Saudi Arabia, the UAE, the US and Australia.

    WhyHow people read content depends on language and culture.

  3. Behavioural dataQuantitative

    Analysed browsing behaviour across markets and devices.

  4. SurveyQuantitative

    Ran a large-scale survey in all 10 markets.

    WhyMeasure how common each interview theme was, market by market.

  5. TriangulationQual + quant

    Combined all four sources market by market to separate local issues from global ones.

With
Product owners, product designers, content and localisation, data analytics
Decision
Teams got a market-by-market basis for deciding where localisation work mattered most.
06 Fashion e-commerce
SurveyUnmoderated testsInterviewsAnalytics

Defining the audience for a new category

The business wanted to grow its modest fashion category without a clear picture of who its customers were.

852survey respondents
3survey languages
6unmoderated test participants
13interviews, including 2 influencers
Markets in this study
UKUnited KingdomTests + interviews
USUnited StatesTests + interviews
DEGermanyTests + interviews
AEUAETests
JPJapanTests
Research process
  1. On-site surveyQuantitative

    852 respondents, in English, Arabic and German.

    WhyStart broad: who is the audience, and what do they prefer?

  2. Unmoderated testsQualitative

    6 participants across several markets tested the category.

    WhySurvey results shaped the tasks, and the tests shaped the interview guide.

  3. Live interviewsQualitative

    13 participants across three markets, including 2 influencers.

    WhyUnderstand motivations and how people shop for modest fashion elsewhere.

  4. AnalyticsQuantitative

    Journey, conversion and click data, plus search terms that came up in testing.

  5. TriangulationQual + quant

    Checked what people said they wanted against how they actually reached and used the category.

With
Product owners, product designers, marketing, data analytics
Decision
The team had a shared audience definition to guide how the category was positioned and how customers would find it.
07 Fashion e-commerce
PaymentsFunnel analysisUsabilityNPSBenchmark

Checkout and payments optimisation

The business wanted more customers to complete checkout, and to understand why people abandoned their bags.

7research questions
4methods combined
5ways the funnel was segmented
Research process
  1. Research questionsSetup

    Framed seven research questions with product and design.

  2. Funnel analysisQuantitative

    Step conversion, "go back a step" rates, time, errors and payment methods, split by market, platform, new vs returning, bag value and items.

    WhyFind where to look before deciding who to talk to.

  3. Interviews and usability testsQualitative

    Focused on the steps and segments the data flagged.

    WhyExplain the drop-offs the numbers showed.

  4. Post-checkout survey and NPSQuantitative

    Captured experiences right after purchase.

  5. Competitor benchmarkExpert review

    Compared checkout flows against best practice.

  6. TriangulationQual + quant

    The data showed where people struggled, research explained why, and the benchmark showed how others solve it.

With
Product owners, product designers, data analytics, engineering
Decision
The team prioritised checkout improvements by where friction was greatest and what caused it.
08 Fashion e-commerce
Secondary researchData consolidation

Reframing a request: the delivery experience

Stakeholders asked for a usability test of delivery date information, but they had more questions than one test could answer.

Research process
  1. ReframingSetup

    Scoped the request and moved from a single usability test to secondary research.

    WhyAlmost every major end-to-end study had already touched on delivery.

  2. Research auditSecondary

    Collected delivery insights from past studies and data sources.

  3. Data cleaningSynthesis

    Checked every source for incomplete or incorrect data before using it.

    WhyConclusions are only as reliable as their weakest source.

  4. TriangulationMulti-source

    Brought different formats and structures into one framework, using AI tools to support interpretation.

  5. Working sessions and playbacksCo-creation

    Shared findings with product, logistics and marketing, and gathered their perspectives.

With
Product owners, logistics, marketing
Decision
Stakeholders got answers without new fieldwork, and logistics and marketing joined the conversation about the delivery experience.
09 Freelance
Market analysisCompetitor researchHeuristic review

Research for MVP product launches

As a freelancer, I work with clients preparing to launch new products who need evidence before investing further in building and going to market.

Research process
  1. Market analysisSecondary

    Mapped the audience, its needs and market trends.

    WhyConfirm there is a real need before judging the product.

  2. Competitor researchExpert review

    Compared competitors' features, positioning and user experience.

    WhyCompetitors set the bar users will judge the MVP against.

  3. Heuristic reviewExpert review

    Evaluated the MVP against usability heuristics.

    WhyA fast, low-cost way to find issues before real users do.

  4. TriangulationMulti-source

    Compared market needs, competitor offerings and MVP gaps to find where the product should stand out.

  5. Launch recommendationsSynthesis

    Prioritised what to fix, how to position and what to build next.

With
Founders, product designers, developers, marketing and sales
Decision
Clients decided what to fix before launch, how to position against competitors and what to build next.
10 Customer insights · AI
NPSAI-assisted analysisResearch ops

Using AI to categorise NPS feedback

The company's NPS survey collected a large volume of open comments. Sorting them by hand was slow, so issues reached the teams that could fix them late.

Research process
  1. Category frameworkCo-creation

    Defined issue categories with stakeholders.

    WhyCategories teams recognise make the output easy to act on.

  2. AI classificationQuantitative

    Used AI to sort open comments into the categories at scale.

  3. Human validationQualitative

    Reviewed samples by hand to check accuracy and refine the categories.

    WhyAI speeds up the work; a researcher keeps it accurate.

  4. TriangulationQual + quant

    Combined categories with scores to show which issues mattered most.

  5. Repeatable processResearch ops

    Turned the workflow into a routine for every survey wave.

With
Product owners, marketing, sales, data analytics
Decision
A slow manual task became a routine process, so teams get categorised issues sooner and can prioritise fixes.
Quick-turn studies

Direction in weeks

Behavioural analytics · 1 month of data

What people really do in a documents area

Worked with event data to map behaviour, then segmented users with and without documents to stop empty visits from skewing every metric.

Led to a better empty state, usability testing of the signing step, and segmented metrics.

Heuristic evaluation · 1 week

Reviewing an error-handling framework

Evaluated a new error-message framework for a family of products against Nielsen's usability heuristics.

Led to shared validation principles, a consistent recovery model and reusable templates.

Methods

Methods, and where I've used them

Research methods used in each project
Project 01, OnboardProject 02, DashboardProject 03, SyntheticProject 04, MetricsProject 05, LocalProject 06, CategoryProject 07, CheckoutProject 08, DeliveryProject 09, MVPsProject 10, NPS + AI
InterviewsUsedUsedUsed
Usability & unmoderated testsUsedUsedUsedUsed
Surveys & NPSUsedUsedUsedUsedUsed
Behavioural & funnel analyticsUsedUsedUsedUsedUsed
Feedback analysisUsedUsed
Secondary researchUsedUsedUsedUsedUsed
TriangulationUsedUsedUsedUsedUsedUsedUsedUsedUsed
Competitor & heuristic reviewUsedUsed
UX metrics & HEARTUsed
Synthetic usersUsed
AI-assisted analysisUsedUsedUsed
Workshops & co-creationUsedUsedUsed
  • Interviews05 Local06 Category07 Checkout
  • Usability & unmoderated tests01 Onboard02 Dashboard06 Category07 Checkout
  • Surveys & NPS02 Dashboard05 Local06 Category07 Checkout10 NPS + AI
  • Behavioural & funnel analytics01 Onboard04 Metrics05 Local06 Category07 Checkout
  • Feedback analysis01 Onboard10 NPS + AI
  • Secondary research01 Onboard03 Synthetic05 Local08 Delivery09 MVPs
  • Triangulation01 Onboard02 Dashboard03 Synthetic05 Local06 Category07 Checkout08 Delivery09 MVPs10 NPS + AI
  • Competitor & heuristic review07 Checkout09 MVPs
  • UX metrics & HEART04 Metrics
  • Synthetic users03 Synthetic
  • AI-assisted analysis03 Synthetic08 Delivery10 NPS + AI
  • Workshops & co-creation04 Metrics08 Delivery10 NPS + AI

Tools: Qualtrics, UserZoom, UserTesting, Hotjar, Google Analytics (GA4), Contentsquare, Looker, Power BI, Figma, AI assistants for analysis, Adobe Creative Suite.

Experience

From design to research

A design degree and brand work taught me how products are made and sold. Almost five years of UX research taught me how to find out what people really need from them.

  • 2026 – now
    UX Researcher

    Premium automotive brand, connected-car platform for drivers and fleet managers

  • 2025
    UX Researcher & Designer

    Consumer subscription apps

  • 2024 – now
    UX Researcher

    Freelance, research for clients launching MVP products

  • 2022 – 2024
    UX Researcher

    Global luxury fashion e-commerce platform

  • 2018 – 2022
    Brand communications & design

    E-commerce, social media and graphic design for consumer brands

Education
  • BSc DesignFederal University of Piauí, Brazil · 2015–2019
  • UX/UI DesignCalifornia Institute of the Arts (CalArts) · 2021
Languages
  • PortugueseNative
  • EnglishFluent
  • GermanBasic
Currently

What I'm reading

Lately I've been reading about the philosophy of science, and how it applies to research practice.

Questions about evidence, induction and how theories get tested are surprisingly close to everyday research work. When is a finding strong enough to act on? What does a small sample really tell us? And what can new tools like synthetic users actually know?

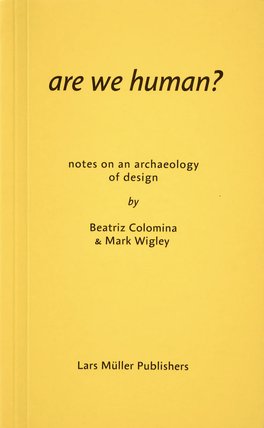
A long-time favourite is Are We Human?, which looks at how design has shaped what it means to be human. It keeps me curious about the people behind every interaction.

Reading nowUnderstanding Philosophy of ScienceJames Ladyman · Routledge, 2002
FavouriteAre We Human? Notes on an Archaeology of DesignBeatriz Colomina & Mark Wigley · Lars Müller Publishers, 2016
👋 Oh, hi! You scrolled all the way down.

Off the clock, I'm a serial hobbyist. Current rotation: knitting, cooking, climbing, swimming and sudoku. Next up: mushroom hunting (with a guide, I promise).

Contact

Let's talk about your next research question.

Email me